We cannot think about a world where you build software for the first time and you never need to fix bugs, improve performance, etc… within a maintenance context. Moreover, most probably you mostly maintain software than keep only adding new products or features. Even with this initial information, you can understand how important it is to have a clear and smooth maintenance strategy for your projects. In this article, we will see best practices about how to build a go project to have a stress-free maintenance context
Source of Quality
We mostly put our software into a pipeline to apply a set of operations to have constant quality for consumers. Possible pipeline items are;
- Static code analysis
- Code Coverage
- Documentation
- Vulnerability analysis
- Artifact generation
Let’s deep dive into each item with supporting examples.
Static Code Analysis
Static code analysis means automation run through your software without executing it. This automation may check, bugs, memory problems, and lots of other areas that are open for improvements. If you are a Go developer, you can see multiple options for static code analysis like Sonar, go vet, staticcheck, etc… Since there are lots of alternatives there, it may be useful to use an aggregator that helps you to select those technologies by configurations and run them.
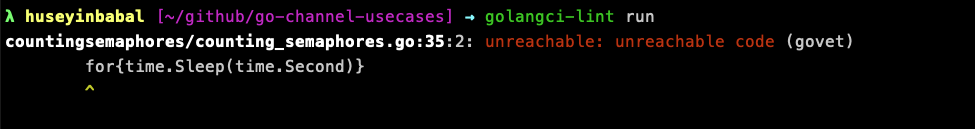
I use golangci-lint to examine my projects on GitHub in an automated way with Github actions. You can run check with golangci-lint run command.
You can check available linters here, and also you can configure each of them independently based on your needs. In order to configure it go vet for your needs, you can create a file .golangci.yml and put following content inside it.
linters-settings:
  govet:
    # report about shadowed variables
    check-shadowing: true
    # settings per analyzer
    settings:
      printf: # analyzer name, run `go tool vet help` to see all analyzers
        funcs: # run `go tool vet help printf` to see available settings for `printf` analyzer
          - (github.com/golangci/golangci-lint/pkg/logutils.Log).Infof
          - (github.com/golangci/golangci-lint/pkg/logutils.Log).Warnf
          - (github.com/golangci/golangci-lint/pkg/logutils.Log).Errorf
          - (github.com/golangci/golangci-lint/pkg/logutils.Log).Fatalf
    # enable or disable analyzers by name
    # run `go tool vet help` to see all analyzers
    enable:
      - atomicalign
    enable-all: false
    disable:
      - shadow
    disable-all: false
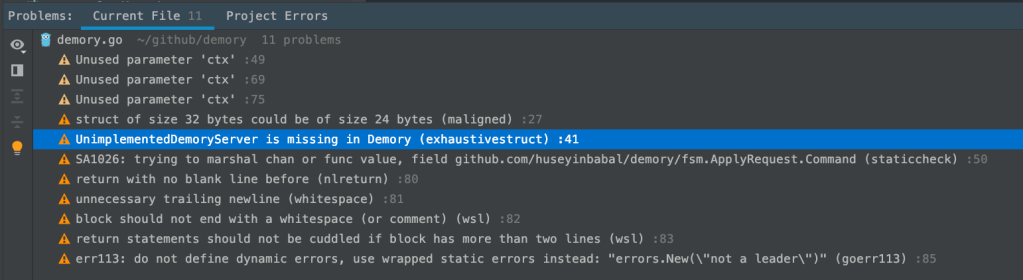
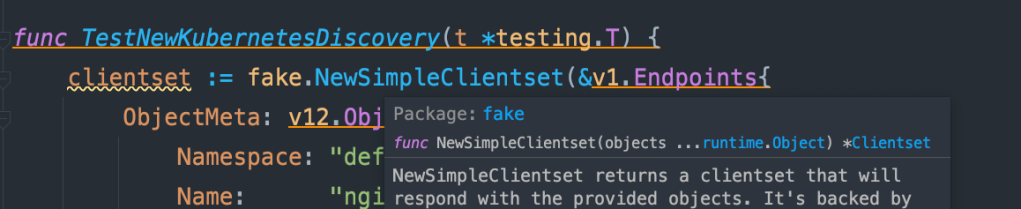
If you are using Goland for your Go projects, there is also a plugin available that lets you to do check within your editor while you are writing your code

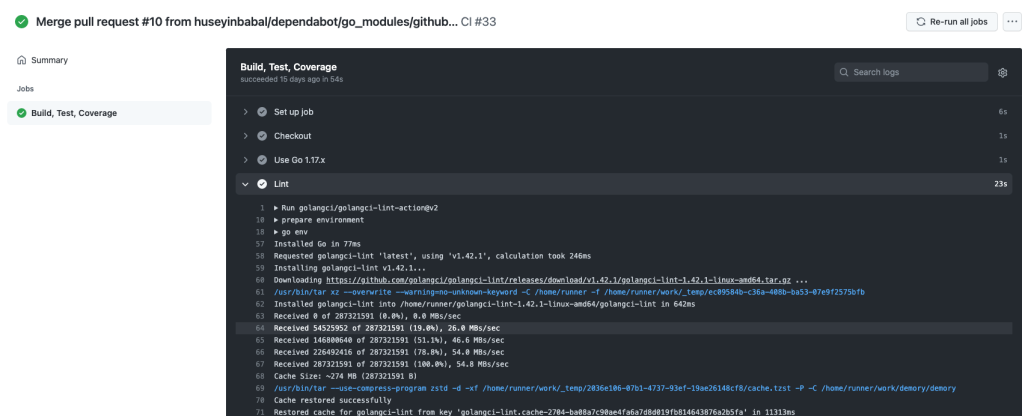
There is also GitHub action plugin for this that allows you to run checks after certain events like pull request create, push to a branch, etc…
on:
  push:
    branches:
      - "main"
  pull_request:
    branches:
      - "main"

name: CI

jobs:

  build:
    name: Build, Test, Coverage
    runs-on: ubuntu-latest
    steps:

      - name: Checkout
        uses: actions/checkout@v2

      - name: Use Go 1.17.x
        uses: actions/setup-go@v2
        with:
          go-version: 1.17

      - name: Lint
        uses: golangci/golangci-lint-action@v2
With the above workflow script, whenever you create a pull request or send changes to main branch , of course this means merging pull requests not to send changes to the main branch directly :), golangci linter will be executed and it may fail the check if it can find something critical.
Code Coverage
We test for our projects to be sure we will not break something while updating a certain functionality. We use coverage strategies to verify if we successfully cover our production code or not. In Go, you can do that with -cover param for within go test command. Keep in mind that, this only analyzes coverage results for you, and if you want to make this process more meaningful, you can pass generated coverage file to the code coverage visualizer after following the example command.
go test -coverprofile c.out -v ./... -run="^Test"
You will see c.out file after the above execution which basically runs all the tests starting with Test in their names
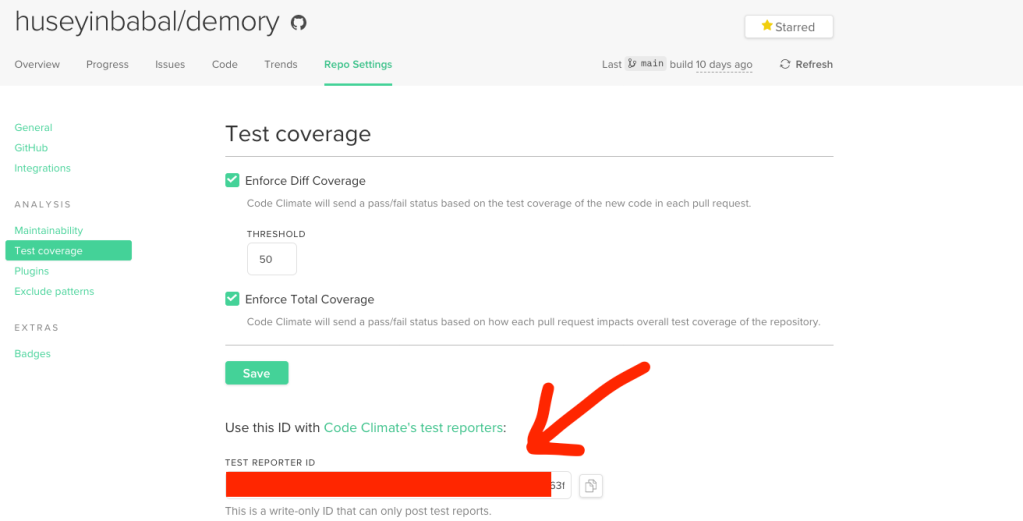
So, what is next? As my next step, I use CodeClimate to analyze the coverage files and provide something meaningful result for me and also fail the check once it finds a threshold failure. In order to use Code Climate, you need to add your project to Code Climate and pass reporter id to your project within GitHub action.
I am using this Github action with the following settings that helps you to run on every pull request.
on:
  push:
    branches:
      - "main"
  pull_request:
    branches:
      - "main"

name: CI

jobs:

  build:
    name: Build, Test, Coverage
    runs-on: ubuntu-latest
    steps:

      - name: Checkout
        uses: actions/checkout@v2

      - name: Use Go 1.17.x
        uses: actions/setup-go@v2
        with:
          go-version: 1.17

      - name: Lint
        uses: golangci/golangci-lint-action@v2

      - name: Test Coverage
        uses: paambaati/codeclimate-action@v3.0.0
        env:
          CC_TEST_REPORTER_ID:${{ secrets.CC_TEST_REPORTER_ID }}
        with:
          coverageCommand: go test -coverprofile c.out -v ./... -run="^Test"
          coverageLocations: ${{github.workspace}}/c.out:gocov
          prefix: github.com/huseyinbabal/demory
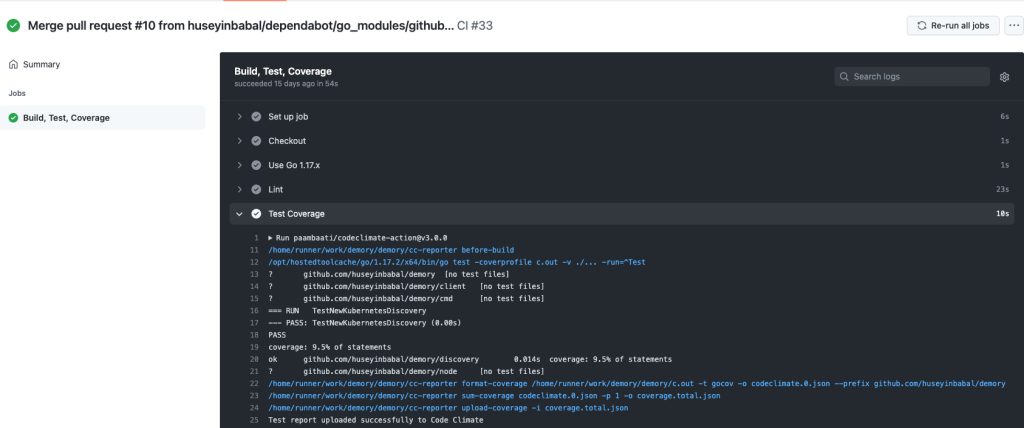
Github action will use test reporter id to find it on CodeClimate and do another analysis for your specific PR. This GitHub action only needs your coverage command and specific location for the coverage file.
Documentation
You may think that why there are documentation steps, but this is very critical for the visibility of your project. Other than documentation within the README file in your project, it is important to add descriptions to your codebase explaining functions, variables, structs, etc… Especially, if you are using values like 0,1 to express a state, it would be better to explain them for which case you return 0 or 1.
// Remove removes value specified by key from a map. It ignores if key is not in the map.
// It returns 1 if removal is successful, returns 0 otherwise.
func (h HashMap) Remove(name, key string) int {
	if !h.exists(name) {
		return 0
	}

	if _, ok := h.data[name][key]; ok {
		delete(h.data[name], key)
		return 1

	}

	return 0
}
You can try documentation locally with the following command after you install godoc tool.
godoc -http=:6060 &
You can see the rendered documentation page for your project by visiting http://localhost:6060.
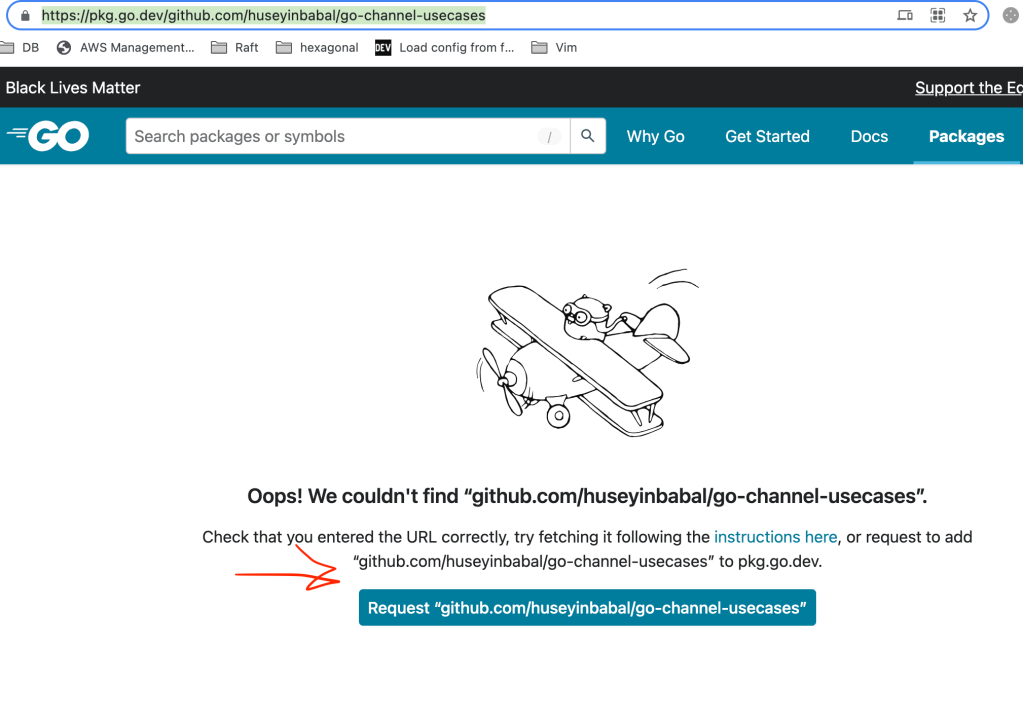
You can make this documentation available to everyone by publishing it to https://pkg.go.dev/, by visiting https://pkg.go.dev/github.com/{user}/{repository} and clicking the Request button if it is not there.
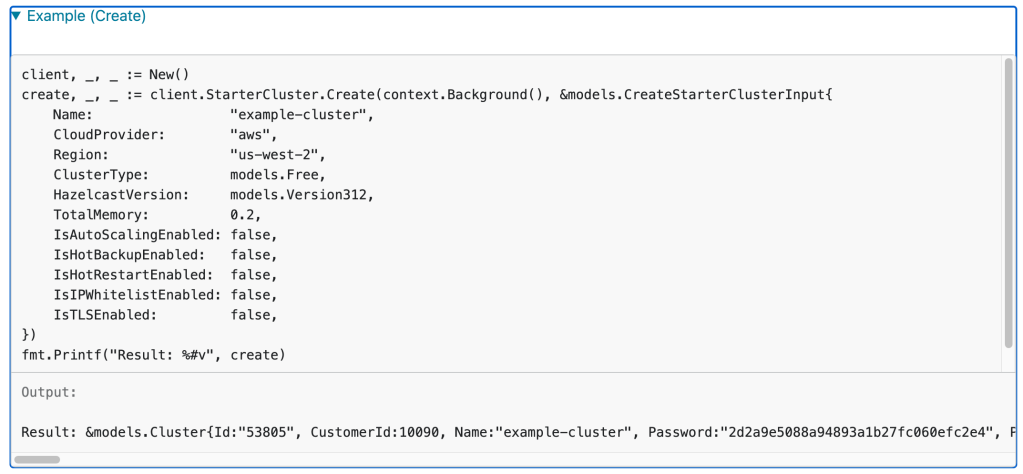
As a developer, I always think that an example is a good way to express the usage of a component in the codebase. In the documentation, you can render examples in a special way by following a convention in go documentation. You can put your examples in test file like below;
func ExampleStarterClusterService_create() {
	client, _, _ := New()
	create, _, _ := client.StarterCluster.Create(context.Background(), &models.CreateStarterClusterInput{
		Name:                 "example-cluster",
		CloudProvider:        "aws",
		Region:               "us-west-2",
		ClusterType:          models.Free,
		HazelcastVersion:     models.Version312,
		TotalMemory:          0.2,
		IsAutoScalingEnabled: false,
		IsHotBackupEnabled:   false,
		IsHotRestartEnabled:  false,
		IsIPWhitelistEnabled: false,
		IsTLSEnabled:         false,
	})
	fmt.Printf("Result: %#v", create)
	//Output:Result: &models.Cluster{Id:"53805", CustomerId:10090, Name:"example-cluster", Password:"2d2a9e5088a94893a1b27fc060efc2e4", Port:31002, HazelcastVersion:"3.12.9", IsAutoScalingEnabled:false, IsHotBackupEnabled:false, IsHotRestartEnabled:false, IsIpWhitelistEnabled:false, IsTlsEnabled:false, ProductType:struct { Name models.ProductTypeName "json:\"name\""; IsFree bool "json:\"isFree\"" }{Name:"Starter", IsFree:true}, State:"PENDING", CreatedAt:"2020-09-08T07:15:13.000Z", StartedAt:"2020-09-08T07:15:13.000Z", StoppedAt:"", Progress:struct { Status string "json:\"status\""; TotalItemCount int "json:\"totalItemCount\""; CompletedItemCount int "json:\"completedItemCount\"" }{Status:"Preparing", TotalItemCount:4, CompletedItemCount:0}, CloudProvider:struct { Name string "json:\"name\""; Region string "json:\"region\""; AvailabilityZones []string "json:\"availabilityZones\"" }{Name:"aws", Region:"us-west-2", AvailabilityZones:[]string{"us-west-2a"}}, DiscoveryTokens:[]models.DiscoveryToken{models.DiscoveryToken{Source:"default", Token:"fd7Zzw2xbxQ692nHqyPUh7Bq9bSLxm2u8tvflzZQ8eqzD1TmUx"}}, Specs:struct { TotalMemory float64 "json:\"totalMemory\""; HeapMemory int "json:\"heapMemory\""; NativeMemory int "json:\"nativeMemory\""; Cpu int "json:\"cpu\""; InstanceType string "json:\"instanceType\""; InstancePerZone int "json:\"instancePerZone\"" }{TotalMemory:0.2, HeapMemory:0, NativeMemory:0, Cpu:0, InstanceType:"", InstancePerZone:0}, Networking:struct { Type string "json:\"type\""; CidrBlock string "json:\"cidrBlock\""; Peering struct { IsEnabled bool "json:\"is_enabled\"" } "json:\"peering\""; PrivateLink struct { Url string "json:\"url\""; State string "json:\"state\"" } "json:\"privateLink\"" }{Type:"", CidrBlock:"", Peering:struct { IsEnabled bool "json:\"is_enabled\"" }{IsEnabled:false}, PrivateLink:struct { Url string "json:\"url\""; State string "json:\"state\"" }{Url:"", State:""}}, DataStructures:models.DataStructureResponse{MapConfigs:[]models.MapConfigResponse{}, JCacheConfigs:[]models.JCacheConfigResponse{}, ReplicatedMapConfigs:[]models.ReplicatedMapConfigResponse{}, QueueConfigs:[]models.QueueConfigResponse{}, SetConfigs:[]models.SetConfigResponse{}, ListConfigs:[]models.ListConfigResponse{}, TopicConfigs:[]models.TopicConfigResponse{}, MultiMapConfigs:[]models.MultiMapConfigResponse{}, RingBufferConfigs:[]models.RingBufferConfigResponse{}, ReliableTopicConfigs:[]models.ReliableTopicConfigResponse{}}}
}
As you can see, your example starts with an Example prefix and you provide a sample output within one line comment. This example will produce the following rendered documentation
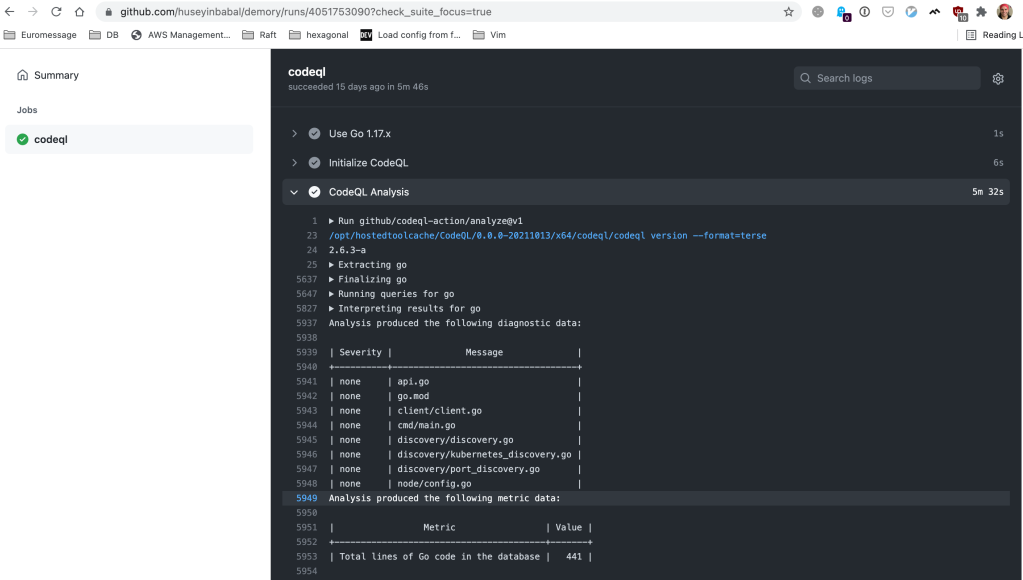
Vulnerability Analysis
We don’t have linter error, have our coverage 100%, and introduced documentation, so what is next? CodeQL is a tool that helps you to discover vulnerabilities across the codebase. It also has GitHub action that lets you configure and run vulnerability scans for a different set of languages including Go.
on:
  push:
    branches:
      - "main"
  pull_request:
    branches:
      - "main"

name: Vulnerability Scanning

jobs:

  codeql:
    runs-on: ubuntu-latest
    steps:

      - name: Checkout
        uses: actions/checkout@v2

      - name: Use Go 1.17.x
        uses: actions/setup-go@v2
        with:
          go-version: 1.17

      - name: Initialize CodeQL
        uses: github/codeql-action/init@v1
        with:
          language: 'go'

      - name: CodeQL Analysis
        uses: github/codeql-action/analyze@v1
With the above workflow definition, you can run a vulnerability scan on every pull request and merge it to the main branch. This simply initializes the CodeQL project on your repository and analyzes it afterward.
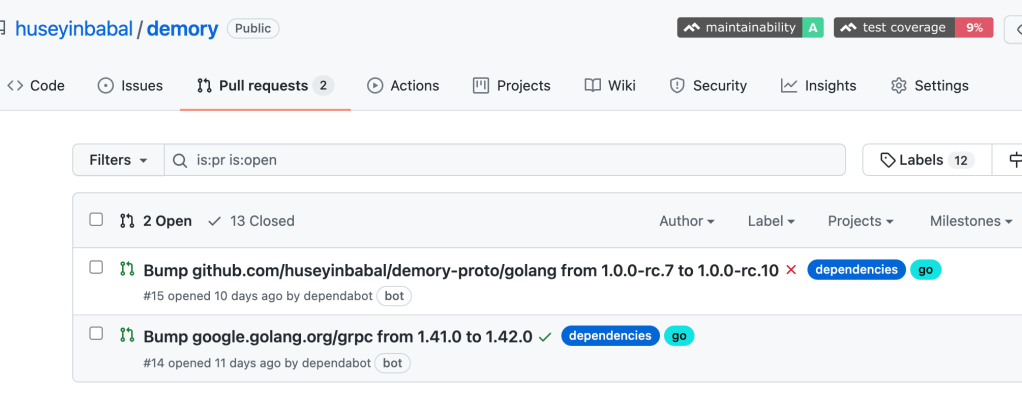
Within the vulnerability context, you may also think to keep your dependencies up-to-date so that you will have the latest patches for your dependencies. Dependabot is the best solution for this operation, and yes it can be easily configured by adding dependabot.yml file to .github folder in your project like following
version: 2
updates:
  - package-ecosystem: gomod
    directory: /
    schedule:
      interval: daily
  - package-ecosystem: "github-actions"
    directory: "/"
    schedule:
      interval: daily
With the above definition you will;
- Get notifications for your project dependencies every day and it will create a pr for you
- Get notifications for your github action plugins and create pr daily.
Artifact Generation
There are multiple ways to distribute your project in different formats like binary, source code, docker image, etc… Especially binary distribution is very popular in Go since you can easily compile source code into a binary for different operating systems and architecture. You can always manually do that, but to have stress-free maintenance, we can automate it with Go Releaser
Go Releaser helps you to fastly deliver Go projects. You simply create a .goreleaser.yml file and execute goreleaser release.
# .goreleaser.yml
builds:
  - main: ./cmd/cli
    id: "cli"
    binary: cli
    goos:
      - linux
      - darwin
      - windows
dockers: # You need to have Dockerfile in your root folder by default
  - image_templates:
    - huseyinbabal/demory
With the above configuration, you can build the binary with a name cli, and also it can generate a docker image with the name huseyinbabal/demory. There are lots of values to this configuration, and please refer here for the rest of the options.
Hopefully, there is a Github Action plugin for this one, and you can simply configure it like below;
name: Go Releaser

on:
  push:
    tags:
      - '*'

jobs:
  goreleaser:
    runs-on: ubuntu-latest
    steps:
      -
        name: Checkout
        uses: actions/checkout@v2
        with:
          fetch-depth: 0
      -
        name: Set up Go
        uses: actions/setup-go@v2
        with:
          go-version: 1.15
      -
        name: Run GoReleaser
        uses: goreleaser/goreleaser-action@v2
        with:
          distribution: goreleaser
          version: latest
          args: release --rm-dist
        env:
          GITHUB_TOKEN: ${{ secrets.GITHUB_TOKEN }}
Summary
You can always have a productive development environment by using the correct set of tools during Go development. You only focus on your business logic, and critical checks can be handled by automation like Github Actions. Even you can generate artifacts for your consumers. By doing this, you can love coding with your favorite programming language again 🙂
You can check my open source project here to see example automations.

One thought on “Maintainable Go Projects”