
Once upon a time, you were on-call within your team schedule and your phone started to ring at midnight… You thought “What the hell is this number?” then you accepted the call. The machine started talking to you, “The CPU of Payment Service is 99 percent right now, and somebody should take an action. To acknowledge, press 1 or …“. You acknowledged the call and jumped into your desk to understand what is going on. You said, “Ok, what do we have?”
- We are using Java, and our services like Payment Service works on JVM.
- JVM is a process and it has an isolated area in memory. The problem is in this process, but what else? Who is causing this problem in this process?
- Ok, some code pieces should cause this problem, and those code pieces like functions, they are being executed by threads. Yes, threads! Even you don’t have an explicit thread, it is executed in main thread.
- However, since JVM has very good memory management, I always trust it, but now how can I see the status of threads like I see the status of processes by using the top command?
- [After drinking coffee], Right, thread dumps!
If you want to be faster than this, then this article is just for you. In this article, we will see what are threads for, and how can we see the status of them mostly for analyzing the root cause of a problem, then we will try to read thread dump logs together.
What is Thread Dump
Thread dump provides the state of threads in a running JVM process. Before we jump into taking thread dumps, let’s take a look at what the thread dump state looks like. Notice that, most of the threads are not in the below example to make it short.
2022-07-21 21:05:40
Full thread dump OpenJDK 64-Bit Server VM (11.0.10+9 mixed mode):

Threads class SMR info:
_java_thread_list=0x000060000130a540, length=14, elements={
0x00007fe738809000, 0x00007fe72f819800, 0x00007fe72e00c000, 0x00007fe72e02b000,
0x00007fe72f008800, 0x00007fe72f024000, 0x00007fe72f80e000, 0x00007fe72f024800,
0x00007fe6de008800, 0x00007fe72f179000, 0x00007fe72f1fe000, 0x00007fe72f1ff000,
0x00007fe72f24c800, 0x00007fe738b26800
}

"main" #1 prio=5 os_prio=31 cpu=2831.00ms elapsed=13.33s tid=0x00007fe738809000 nid=0x2403 runnable  [0x0000700001229000]
   java.lang.Thread.State: RUNNABLE
	at java.util.concurrent.ThreadPoolExecutor.execute(java.base@11.0.10/ThreadPoolExecutor.java:1347)
	at java.util.concurrent.AbstractExecutorService.submit(java.base@11.0.10/AbstractExecutorService.java:118)
	at com.huseyin.threaddumpanalysis.Application.main(Application.java:15)

"pool-1-thread-1" #12 prio=5 os_prio=31 cpu=8.32ms elapsed=12.93s tid=0x00007fe72f179000 nid=0x9e03 waiting on condition  [0x0000700002360000]
   java.lang.Thread.State: TIMED_WAITING (sleeping)
	at java.lang.Thread.sleep(java.base@11.0.10/Native Method)
	at com.huseyin.threaddumpanalysis.Application.lambda$newTask$0(Application.java:24)
	at com.huseyin.threaddumpanalysis.Application$$Lambda$19/0x0000000800105840.run(Unknown Source)
	at java.util.concurrent.Executors$RunnableAdapter.call(java.base@11.0.10/Executors.java:515)
	at java.util.concurrent.FutureTask.run(java.base@11.0.10/FutureTask.java:264)
	at java.util.concurrent.ThreadPoolExecutor.runWorker(java.base@11.0.10/ThreadPoolExecutor.java:1128)
	at java.util.concurrent.ThreadPoolExecutor$Worker.run(java.base@11.0.10/ThreadPoolExecutor.java:628)
	at java.lang.Thread.run(java.base@11.0.10/Thread.java:834)

"G1 Young RemSet Sampling" os_prio=31 cpu=1.59ms elapsed=13.33s tid=0x00007fe72e016800 nid=0x4d03 runnable
"VM Periodic Task Thread" os_prio=31 cpu=5.91ms elapsed=13.26s tid=0x00007fe72e0a6800 nid=0xa203 waiting on condition

JNI global refs: 9, weak refs: 0
Thread Dump Initial Metadata
2022-07-21 21:05:40
Full thread dump OpenJDK 64-Bit Server VM (11.0.10+9 mixed mode):
Thread dump analysis file starts with some metadata for start time and your java version. For above example, the analysis time is 2022-07-21 21:05:40 and the JVM version is OpenJDK 64-Bit Server VM (11.0.10+9 mixed mode) where mixed-mode means, JVM contains both client and server java compilers.
Self Memory Reclamation (SMR)
Threads class SMR info:
_java_thread_list=0x000060000130a540, length=14, elements={
0x00007fe738809000, 0x00007fe72f819800, 0x00007fe72e00c000, 0x00007fe72e02b000,
0x00007fe72f008800, 0x00007fe72f024000, 0x00007fe72f80e000, 0x00007fe72f024800,
0x00007fe6de008800, 0x00007fe72f179000, 0x00007fe72f1fe000, 0x00007fe72f1ff000,
0x00007fe72f24c800, 0x00007fe738b26800
}
This part contains the address of the threads which are non-VM and non-GC. You can also see the count of those threads in this section. In order to verify those addresses, you can search for 0x00007fe738809000 of them and you will see it will be found in the upcoming thread informations like below.
"Reference Handler" #2 daemon prio=10 os_prio=31 cpu=0.33ms elapsed=13.30s tid=0x00007fe72f819800 nid=0x3703 waiting on condition [0x000070000193f000]
Thread Informations
"pool-1-thread-1" #12 prio=5 os_prio=31 cpu=8.32ms elapsed=12.93s tid=0x00007fe72f179000 nid=0x9e03 waiting on condition  [0x0000700002360000]
   java.lang.Thread.State: TIMED_WAITING (sleeping)
	at java.lang.Thread.sleep(java.base@11.0.10/Native Method)
	at com.huseyin.threaddumpanalysis.Application.lambda$newTask$0(Application.java:24)
	at com.huseyin.threaddumpanalysis.Application$$Lambda$19/0x0000000800105840.run(Unknown Source)
	at java.util.concurrent.Executors$RunnableAdapter.call(java.base@11.0.10/Executors.java:515)
	at java.util.concurrent.FutureTask.run(java.base@11.0.10/FutureTask.java:264)
	at java.util.concurrent.ThreadPoolExecutor.runWorker(java.base@11.0.10/ThreadPoolExecutor.java:1128)
	at java.util.concurrent.ThreadPoolExecutor$Worker.run(java.base@11.0.10/ThreadPoolExecutor.java:628)
	at java.lang.Thread.run(java.base@11.0.10/Thread.java:834)
Each thread in thread dump contains following informations
Name
In our example it is "pool-1-thread-1". This is the name of thread where it is automatically set by JVM if you don’t explicitly set it in your application. For example, if create a ExecutorService pool with size 4, you will see the thread names will be pool-1-thread-1, pool-1-thread-2, pool-1-thread-3, pool-1-thread-4. You can explicitly set thread name by calling setName on thread.
ID
This is the autogenerated id of the specific thread, which is #12 in our example, where you can access it via getId on specific thread
Priority
This is the priority of corresponding thread. In our case it is 5, but it can range between 1 to 10 and this number is used by thread scheduler to decide on which thread to schedule.
Address
This field might be a bit tricky since it is stated with tid, but it is not Thread ID, it is the address of Thread provided by JVM
OS Thread ID
This is specified by nid and they are the thread id provided by Operating System.
Status
The status of the thread which is waiting on condition in our case. We will see the thread states soon
Stack Trace Pointer
This is the address of last stack trace mapped to specific thread.
Now that we see the fields of thread, let’s take a look what are the possible thread statuses
Thread Statuses
At a certain time, a thread status can be one of the followings as you can see also in the Thread.State enum.
- NEW: A thread which is not started yet.
- RUNNABLE: A thread which is being executed in JVM
- BLOCKED: A blocked thread which is waiting for a monitor lock
- WAITING: A thread which is waiting for other thread indefinitely
- TIMED_WAITING: A thread which is waiting for other thread up to specified maximum time
Those states are really deserves a dedicated article, I hope will prepare it soon.
How to Take Thread Dump
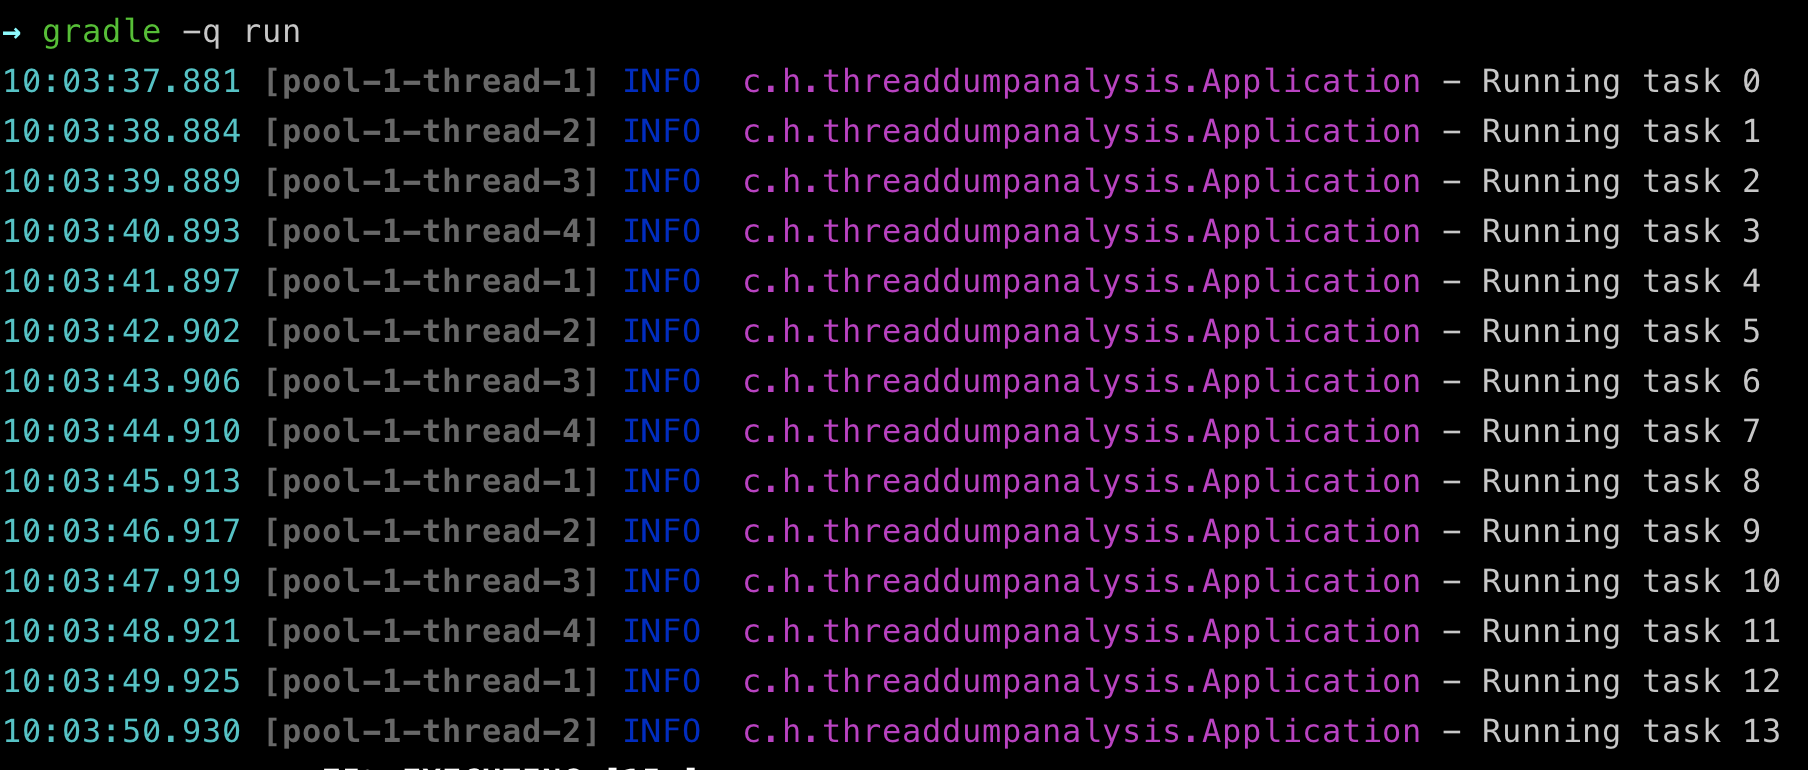
Let say that you have following application and want to take a thread dump to see what are the statuses for threads while it is running.
package com.huseyin.threaddumpanalysis;

import java.util.concurrent.ExecutorService;
import java.util.concurrent.Executors;

import lombok.extern.slf4j.Slf4j;

@Slf4j
public class Application {

    public static void main(String[] args) throws InterruptedException {
        ExecutorService executor = Executors.newFixedThreadPool(4);
        int counter = 0;
        while (true) {
            executor.submit(newTask(counter));
            counter++;
            Thread.sleep(1000);
        }
    }

    private static Runnable newTask(int i) {
        return () -> log.info("Running task {}", i);
    }
}
This application just creates a new runnable task and submits it to executor service to let it handle that by using its thread pool.

In order to take thread dump of this application, you need to know what is the process id of running underlying JVM of your application first. You can use jps command to see only java processes as follows.
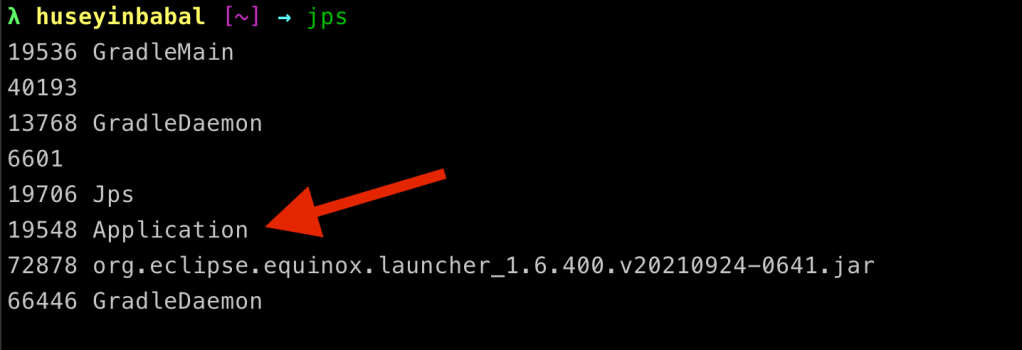
Now that we found the process id, let’s take a look at how can we take thread dump of this JVM process.
With Kill Signal
You can take thread dump of JVM process by using kill signal as follows
kill -3 19548 # we already found process id in previous sectionThe kill signal with number 3 means SIGQUIT, but JVM has a special handling mechanism for this signal in a way that, it takes thread dump and application continues to run without disruption. You can see all kill signals which are important to JVM here. After triggering thread dump, it will print analysis in standard output, but you can also redirect those logs to a dedicated file with following JVM arguments.
-XX:+UnlockDiagnosticVMOptions -XX:+LogVMOutput -XX:LogFile=/tmp/jvm.log“kill -3 pid” usage for thread dump is useful especially when you use containerized java application where only JRE (Java Runtime Environment) installed, JRE installation does not have tools like “jstack” to take thread dump.
Tweet
With jstack Command
If you have JDK (Java Development Toolkit) installed on your system, you can use jstack tool to take thread dump for specified JVM process as follows.
jstack 19548 # to take thread dump
jstack 19548 > /tmp/app.tdump # to save analysis result to file
With jcmd Command
jcmd command is another helpful command coming from JDK bundle and it has capability to do several things for specific JVM process. To take thread dump, we use following to tell jcmd command to print thread dump analysis of provided process id.
jcmd 19548 Thread.printWith VisualVM
VisualVM is an UI application that helps you to see various insights about JVM process and trigger some actions like Thread Dump, Heap Dump, etc…
If Threads tab is missing in your VisualVM application, you can enable that by adding “-Djava.rmi.server.hostname=localhost” JVM argument to your application.
Tweet
Once you run your application and open VisualVM application as follows;
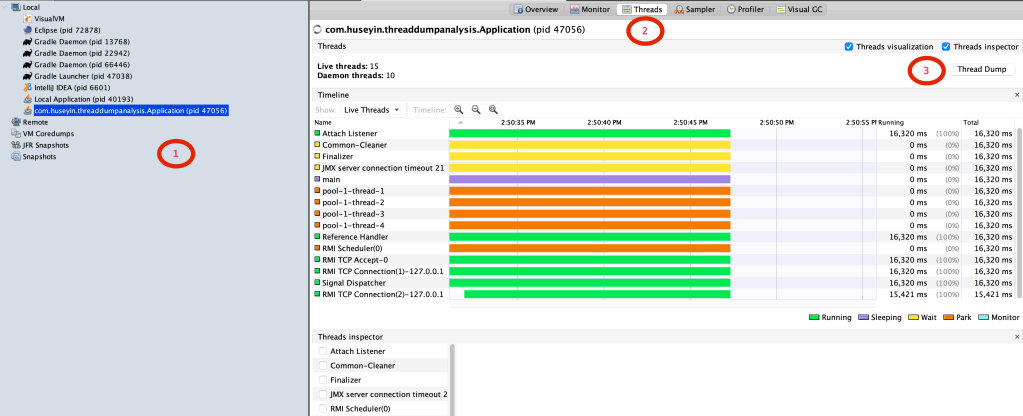
- Select the process where your application runs
- Select “Threads” tab
- Click “Thread Dump” button to take thread dump.
After above steps, you will see thread dump analysis in VisualVM UI
To sum up, we saw how to take thread dump with a couple of alternatives and read analysis output briefly. In analysis file, you can see some metadata about thread dump start time, overall thread counts and also thread information for each threads which are non-VM and non-GC. If you have proper tooling, you can run them against JVM process, alternatively you can send kill signal to tell JVM to take thread dump for you.
You can see the source code of example used in this article here.

Hey, great read! I particularly enjoyed your in-depth discussion of thread dumping, since it was something I hadn’t really thought of before. Being a fellow tech blogger myself, I also really appreciate how organized and well-formatted everything was – it definitely made the content much more digestible overall. Keep up the awesome work!
LikeLiked by 1 person
Thanks ☺️ I will be posting weekly articles, it will be about java threads nowadays 😉
LikeLike
Awesome, I’ll definitely stay tuned!
LikeLiked by 1 person